
 Image 1 of 4
 Image 2 of 4
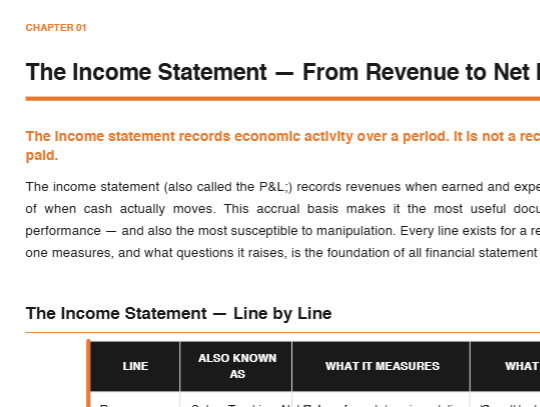 Image 3 of 4
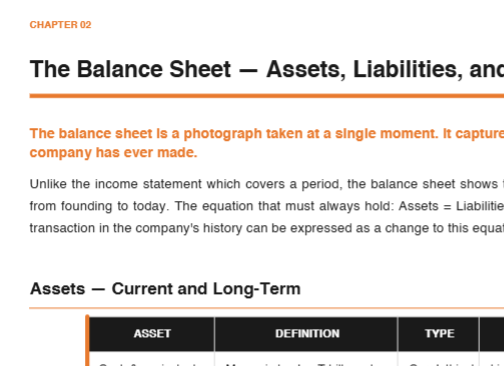 Image 4 of 4
The income statement, balance sheet, and cash flow statement are not three separate documents. They are three views of the same underlying financial reality. Reading them in isolation — the most common approach — produces at best a partial picture and at worst a dangerously wrong one.
This guide walks you through every line of every statement, explains how they connect, and teaches you the forensic skills to find what management didn't put in the headline numbers.
WHAT'S INSIDE — 8 CHAPTERS:
→ The Income Statement — From Revenue to Net Income
Fourteen income statement line items — from gross revenue through diluted EPS — with their alternative names, precise definitions, what they measure, and what to investigate when the number looks wrong. The five income statement quality questions every analyst should be asking before drawing any conclusion from a P&L.
→ The Balance Sheet — Assets, Liabilities, and Equity
The complete asset taxonomy (nine items from cash through deferred tax assets) and the complete liability and equity taxonomy (nine items from accounts payable through accumulated other comprehensive income), each with definition, current vs. long-term classification, and the specific analytical focus for each. The equation that must always hold: Assets = Liabilities + Shareholders' Equity.
→ The Cash Flow Statement — Where Money Actually Moves
Every adjustment in the operating cash flow reconciliation — thirteen line items from net income through the OCF result — with the economic meaning of each, the direction it moves, and the analytical implication. Why the cash flow statement is the hardest financial statement to manipulate and therefore the most reliable indicator of real economic performance.
→ How the Three Statements Connect
Twelve real transactions mapped across all three statements simultaneously: selling on credit, collecting a receivable, buying inventory, recording depreciation, issuing bonds, paying interest, repurchasing stock, and recognizing deferred revenue. This is the table that makes the linkage concrete and testable — not theoretical.
→ Key Ratios — The Right Way to Use Them
Fourteen core ratios across valuation, profitability, liquidity, leverage, efficiency, and growth — each with formula, what it reveals, and the correct interpretation context. Ratios are questions that tell you where to look. They are not conclusions. This chapter teaches the difference.
→ Accounting Manipulation Warning Signs
The Beneish M-Score — the eight-variable model that has successfully flagged Enron, WorldCom, and others before their public collapses — explained component by component. Plus a nine-row red flag checklist with detection method and historical example for each: Sunbeam's channel stuffing, Autonomy's goodwill write-down, Enron's SPEs, Luckin Coffee's related-party revenues.
→ Deferred Revenue, D&A, and Non-Cash Items
Deferred revenue as a quality signal: five scenarios from growing SaaS subscriptions (bullish) to accelerating decline (churn warning). The CapEx vs. D&A relationship — what it means when CapEx exceeds D&A, when they're equal, and when CapEx consistently falls below D&A for multiple years (chronic underinvestment: future revenue and margin risk).
→ Earnings Quality — The Forensic Framework
An eight-dimension earnings quality scorecard: cash conversion, accrual quality, revenue vs. AR growth, CapEx vs. D&A, gross margin stability, tax rate consistency, recurring vs. non-recurring items, and goodwill impairment history — with the high-quality and low-quality signal for each dimension and how to measure it. The master checklist that applies every dimension in a five-minute review.
WHO THIS IS FOR:
Investors who want to analyze companies rather than read commentary about them. Anyone who has ever looked at a financial statement and not known where to start. Finance students, self-taught investors, and professionals who want a clean reference.
FORMAT: PDF — Instant download. No subscription. Yours forever.