
 Image 1 of 4
 Image 2 of 4
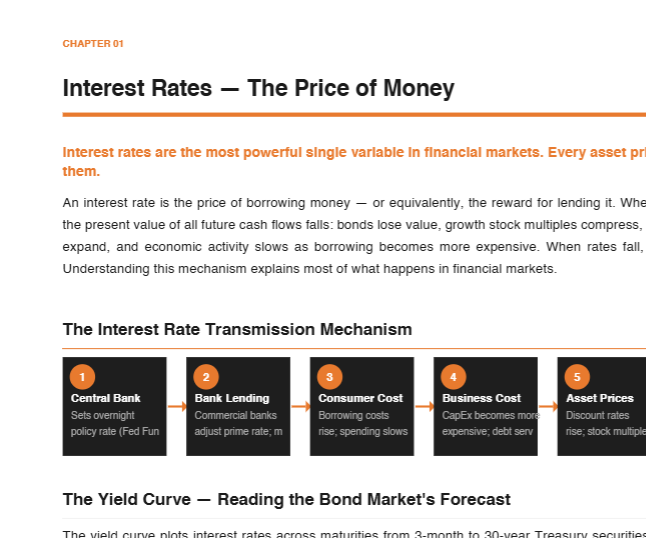 Image 3 of 4
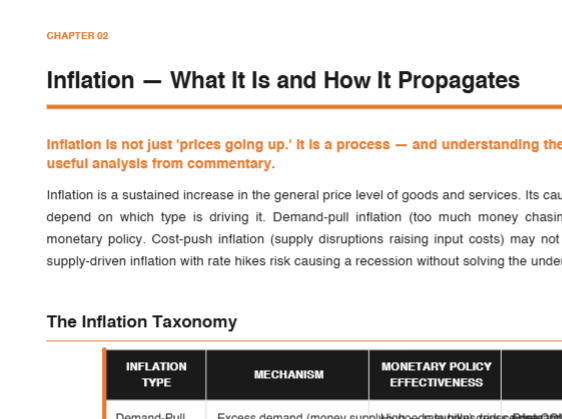 Image 4 of 4
Most macroeconomics content is either too academic to be useful or too simplified to be accurate. This guide takes an institutional approach — explaining the concepts the way macro researchers, central bankers, and professional investors actually think about them — in language that doesn't require a PhD to follow.
Understanding macro doesn't predict markets. But not understanding it leaves you unable to reason about the environment your investments operate in.
WHAT'S INSIDE — 8 CHAPTERS:
→ Interest Rates — The Price of Money
The interest rate transmission mechanism — from Fed Funds Rate through bank lending through consumer and business costs through asset prices through inflation — step by step. The yield curve and its four shapes: normal, flat, inverted, and steepening. The yield curve's historical record: seven of eight US recessions since 1960 preceded by inversion, with an average 12-month lag from inversion to recession start.
→ Inflation — What It Is and How It Propagates
Five inflation types — demand-pull, cost-push, built-in wage-price spiral, asset price inflation, and hyperinflation — with the mechanism, monetary policy effectiveness, and historical example for each. The six key inflation measures from CPI through Core PCE through real-time breakeven rates — with what each tracks, what the Fed targets, and what each fails to capture.
→ Central Banks — The Federal Reserve and Its Tools
Seven Fed tools — Federal Funds Rate, open market operations, reserve requirements, discount window, quantitative easing, forward guidance, and yield curve control — with mechanism, timeframe, and effectiveness for each. The two fundamental limitations of monetary policy: the long and variable lag problem (Friedman) and the supply-side problem (rate hikes cannot fix supply disruptions; they only reduce demand — potentially causing a recession without solving inflation).
→ The Debt Cycle — Ray Dalio's Framework
The short-term debt cycle (5–8 years): six-stage sequence from credit expansion through inflation through tightening through recession through easing and back to expansion. The long-term debt cycle (75–100 years): what happens when short-term cycles accumulate so much debt that conventional monetary policy loses its power. The five phases of the long-term cycle with their characteristics, policy responses, and historical analogues.
→ Recessions — Causes, Patterns, and Recovery
Five recession types — policy-induced, credit/financial crisis, external shock, inventory correction, and structural/secular — with cause, typical depth and duration, recovery profile, and historical example for each. The framework for distinguishing between recession types matters because it determines which assets are likely to perform and how long the recovery takes.
→ Unemployment — The Labor Market Mechanics
The U-1 through U-6 unemployment measure hierarchy — with definition, typical US range, and what each excludes. The NAIRU concept (Non-Accelerating Inflation Rate of Unemployment) and why the Fed's estimate of 4–4.5% determines how tight labor markets can get before the inflation policy response kicks in.
→ Quantitative Easing and Modern Monetary Tools
The QE mechanics — exactly how asset purchases create reserves, lower long-term rates, and produce the portfolio rebalancing effect that inflates risk asset prices. A full QE program history: QE1 through QE4 (US), ECB QE, and the Bank of Japan's yield curve control — with period, amount, and documented market impact for each.
→ How Macro Regimes Affect Asset Prices
The four-regime framework: Goldilocks (growth above / inflation below expectations), inflationary boom (both above), stagflation (growth below / inflation above), and deflationary bust (both below). Best and worst performing assets in each regime. A historical regime table from 1995 through 2024 — mapping each period to its regime, dominant driver, and what worked.
WHO THIS IS FOR:
Investors who want to understand the environment their portfolios operate in. Business owners planning through economic cycles. Anyone who wants to read financial news with a framework rather than just absorbing it.
FORMAT: PDF — Instant download. No subscription. Yours forever.