
 Image 1 of 4
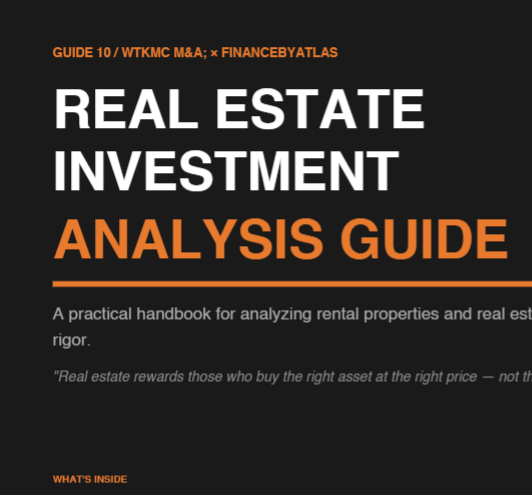 Image 2 of 4
 Image 3 of 4
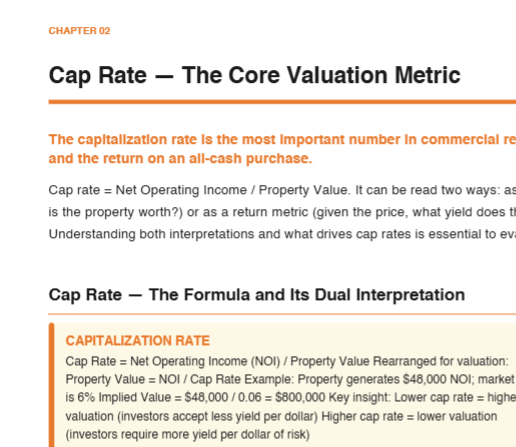 Image 4 of 4
Owning real estate and investing in real estate are two different activities with two different financial outcomes. The investor evaluates NOI, cap rates, cash-on-cash returns, market fundamentals, and exit scenarios before writing a check. The owner responds to a listing, a feeling, or a story about appreciation.
This guide is for investors. It provides every framework needed to analyze a residential or commercial property deal with the same rigor applied by professional acquisition teams.
WHAT'S INSIDE — 8 CHAPTERS:
→ Real Estate Investment Fundamentals
The four components of real estate return — cash flow, appreciation, loan amortization (equity buildup), and tax benefits — and why analyzing only cash flow misses 60–70% of the total return picture. A full property type reference across eight categories from single-family rental to industrial to short-term rental, with typical cap rates, cash flow profile, risk profile, and investor accessibility for each.
→ Cap Rate — The Core Valuation Metric
Cap rate is Net Operating Income divided by property value — and it can be read two ways: as a return (given the price, what yield does this generate?) and as a valuation tool (given the NOI, what is this worth?). This chapter explains both interpretations, the five drivers that move cap rates (interest rates, capital flows, asset quality, lease structure, supply/demand), and a full cap rate reference by market tier and asset class.
→ Net Operating Income — Building It Correctly
Every real estate valuation is built on NOI. Getting it wrong invalidates the entire analysis. This chapter walks through every line item — gross potential rent, vacancy loss, other income, property taxes, insurance, management, maintenance, capital reserves, utilities, and administrative expenses — with how to calculate each, what the professional standard is, and where the typical errors occur. Includes the pro forma trap warning: never underwrite on what the property could earn. Only on what it actually does earn.
→ Cash-on-Cash Return & Financing Analysis
Cash-on-cash return is annual pre-tax cash flow divided by total cash invested. It changes dramatically based on financing structure. A six-row table shows the same property at 0% through 90% LTV — with equity invested, annual debt service, cash flow, and cash-on-cash return at each level — and the risk profile at each leverage point. The leverage effect worked both ways: amplifies returns and amplifies the consequence of vacancy.
→ Appreciation, Equity Buildup & Total Return
A complete total return decomposition on a real property example showing cash flow, appreciation, principal paydown, and tax benefit — and the combined return on invested equity. The counterintuitive insight: over long holding periods in most markets, appreciation and equity buildup dwarf cash flow as contributors to total return. Optimizing only for cash flow at purchase systematically underweights the other three components.
→ Market Evaluation Framework
The single most important factor in real estate returns is market selection — more important than deal selection, more important than the asset itself. This chapter provides a seven-factor market evaluation framework: population trend, employment base, income growth, new supply pipeline, rent growth trend, vacancy rates, and cap rate trajectory — with the bullish and bearish signal for each.
→ Deal Evaluation — The Due Diligence Stack
Eight non-negotiable due diligence items: rent roll verification against lease files, 12-month operating statement reconciliation to bank statements, physical inspection, Phase I environmental assessment, title search and survey, market rent comparison, zoning and regulation review, and seller motivation analysis. Each with what to look for, what documentation to require, and what signals to be most alert to.
→ Bad Deals Disguised as Cash Flow Opportunities
Six patterns that have cost investors real money: the pro forma cash flow deal (underwriting on projected income rather than actual), the price-per-door mislead (metric without NOI context is meaningless), the Class C trap (higher cap rate as compensation for unmodeled risk), the high-interest bridge loan squeeze (negative carry while waiting for rates that don't fall), the Airbnb income projection (peak-season numbers extrapolated to full year), and the rent control blind side (below-market rents with restricted path to market rate).
WHO THIS IS FOR:
First-time real estate investors who want to approach their first deal with professional-grade analysis. Experienced investors who want a systematic evaluation framework. Anyone who has ever relied on a seller's pro forma without knowing why that was a mistake.
FORMAT: PDF — Instant download. No subscription. Yours forever.
Owning real estate and investing in real estate are two different activities with two different financial outcomes. The investor evaluates NOI, cap rates, cash-on-cash returns, market fundamentals, and exit scenarios before writing a check. The owner responds to a listing, a feeling, or a story about appreciation.
This guide is for investors. It provides every framework needed to analyze a residential or commercial property deal with the same rigor applied by professional acquisition teams.
WHAT'S INSIDE — 8 CHAPTERS:
→ Real Estate Investment Fundamentals
The four components of real estate return — cash flow, appreciation, loan amortization (equity buildup), and tax benefits — and why analyzing only cash flow misses 60–70% of the total return picture. A full property type reference across eight categories from single-family rental to industrial to short-term rental, with typical cap rates, cash flow profile, risk profile, and investor accessibility for each.
→ Cap Rate — The Core Valuation Metric
Cap rate is Net Operating Income divided by property value — and it can be read two ways: as a return (given the price, what yield does this generate?) and as a valuation tool (given the NOI, what is this worth?). This chapter explains both interpretations, the five drivers that move cap rates (interest rates, capital flows, asset quality, lease structure, supply/demand), and a full cap rate reference by market tier and asset class.
→ Net Operating Income — Building It Correctly
Every real estate valuation is built on NOI. Getting it wrong invalidates the entire analysis. This chapter walks through every line item — gross potential rent, vacancy loss, other income, property taxes, insurance, management, maintenance, capital reserves, utilities, and administrative expenses — with how to calculate each, what the professional standard is, and where the typical errors occur. Includes the pro forma trap warning: never underwrite on what the property could earn. Only on what it actually does earn.
→ Cash-on-Cash Return & Financing Analysis
Cash-on-cash return is annual pre-tax cash flow divided by total cash invested. It changes dramatically based on financing structure. A six-row table shows the same property at 0% through 90% LTV — with equity invested, annual debt service, cash flow, and cash-on-cash return at each level — and the risk profile at each leverage point. The leverage effect worked both ways: amplifies returns and amplifies the consequence of vacancy.
→ Appreciation, Equity Buildup & Total Return
A complete total return decomposition on a real property example showing cash flow, appreciation, principal paydown, and tax benefit — and the combined return on invested equity. The counterintuitive insight: over long holding periods in most markets, appreciation and equity buildup dwarf cash flow as contributors to total return. Optimizing only for cash flow at purchase systematically underweights the other three components.
→ Market Evaluation Framework
The single most important factor in real estate returns is market selection — more important than deal selection, more important than the asset itself. This chapter provides a seven-factor market evaluation framework: population trend, employment base, income growth, new supply pipeline, rent growth trend, vacancy rates, and cap rate trajectory — with the bullish and bearish signal for each.
→ Deal Evaluation — The Due Diligence Stack
Eight non-negotiable due diligence items: rent roll verification against lease files, 12-month operating statement reconciliation to bank statements, physical inspection, Phase I environmental assessment, title search and survey, market rent comparison, zoning and regulation review, and seller motivation analysis. Each with what to look for, what documentation to require, and what signals to be most alert to.
→ Bad Deals Disguised as Cash Flow Opportunities
Six patterns that have cost investors real money: the pro forma cash flow deal (underwriting on projected income rather than actual), the price-per-door mislead (metric without NOI context is meaningless), the Class C trap (higher cap rate as compensation for unmodeled risk), the high-interest bridge loan squeeze (negative carry while waiting for rates that don't fall), the Airbnb income projection (peak-season numbers extrapolated to full year), and the rent control blind side (below-market rents with restricted path to market rate).
WHO THIS IS FOR:
First-time real estate investors who want to approach their first deal with professional-grade analysis. Experienced investors who want a systematic evaluation framework. Anyone who has ever relied on a seller's pro forma without knowing why that was a mistake.
FORMAT: PDF — Instant download. No subscription. Yours forever.