
 Image 1 of 4
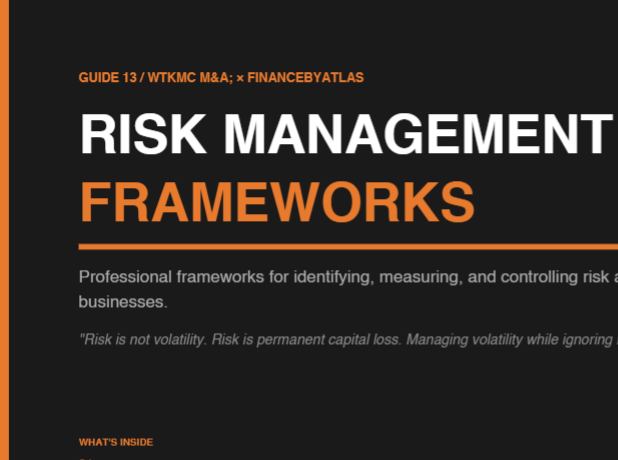 Image 2 of 4
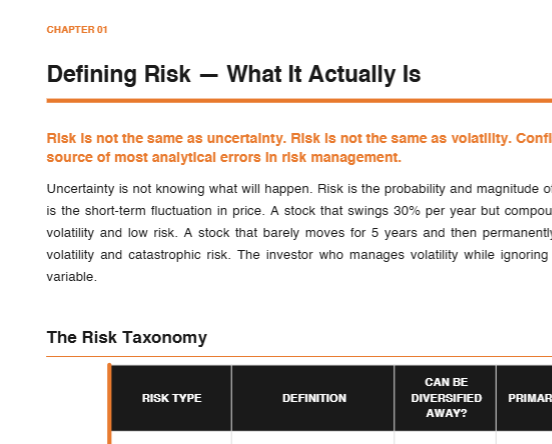 Image 3 of 4
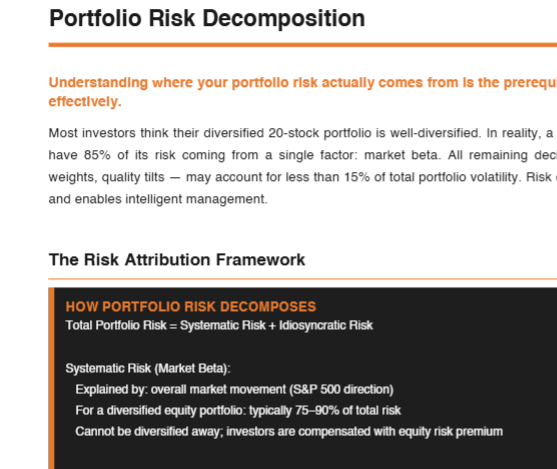 Image 4 of 4
The most common risk management error is optimizing the wrong variable. Standard deviation measures price swings. Real risk is the probability and magnitude of permanent capital loss. A stock that swings 30% per year and compounds at 15% per decade has high volatility and low risk. A stock that barely moves for five years and then permanently falls 80% has low volatility and catastrophic risk.
This guide teaches risk management the way it actually works — with the frameworks used by serious investors, risk managers, and operators who cannot afford to get it wrong.
WHAT'S INSIDE — 8 CHAPTERS:
→ Defining Risk — What It Actually Is
The three-way distinction between uncertainty, risk, and volatility that most financial education conflates. A nine-row risk taxonomy covering idiosyncratic, systematic, factor, liquidity, concentration, leverage, valuation, business model, and regulatory risk — with whether each can be diversified away and the primary management tool for each. Benjamin Graham's margin of safety principle applied as a practical risk management framework.
→ Portfolio Risk Decomposition
For a diversified 20-stock US equity portfolio, approximately 85% of total risk typically comes from a single factor: market beta. This chapter explains how portfolio risk decomposes into systematic and idiosyncratic components, how factor risks sit within the systematic layer, and why understanding risk attribution is the prerequisite to managing it. A full asset pair correlation matrix across eight pairings showing normal vs. crisis correlation — and the implication of each.
→ Downside Protection Strategies
The mathematics of losses: a 50% loss requires a 100% gain to recover. A 75% loss requires a 300% gain. Protecting against large drawdowns is therefore worth dramatically more than generating equivalent additional upside. Eight downside protection strategies — from cash buffers through protective puts through short selling through position concentration limits — with mechanism, cost, and best-use context for each.
→ Diversification — The Right and Wrong Way
Seven diversification dimensions: asset class, geography, sector, factor, time horizon, currency, and liquidity. For each: what true diversification looks like and the most common false diversification that investors mistake for it. Owning 30 stocks in the same sector is a sector fund, not a diversified portfolio. This chapter makes the distinction rigorous and actionable.
→ Leverage Risk — The Silent Amplifier
The leverage risk mathematics: at 2× leverage, a 50% asset decline wipes out equity. At 10× leverage, a 10% decline does the same. At 30× leverage (pre-2008 banks), a 3.3% decline is sufficient. A six-row leverage table from no leverage to 30×+ with the asset decline required for wipeout, the probability of loss, and the appropriate context. The history of financial crises is largely a history of leverage cycles.
→ Liquidity Risk — The Overlooked Threat
Liquidity risk is systematically underpriced because it is invisible during normal markets and catastrophically expensive during crises. A nine-row liquidity spectrum from on-the-run US Treasuries through private equity — with normal liquidity, crisis liquidity, and the illiquidity premium each offers. The core insight: liquidity evaporates precisely when you most need it, which is why it must be planned for when you don't.
→ Tail Risk and Black Swan Events
Six historical tail events — 1987 Black Monday, LTCM, 9/11, the 2008 GFC, COVID, and the 2022 bond market — with magnitude, the number of standard deviations each represented, and why the model in use at the time assigned it near-zero probability. Four tail risk management strategies: anti-fragility, convexity seeking, stress testing beyond historical data, and the barbell strategy.
→ Asymmetric Risk/Reward — The Edge Framework
The expected value framework: probability-weighted outcomes across all scenarios, with a worked example showing how to calculate expected value and identify when the asymmetry favors investment. Five sources of investment edge — information, analytical, behavioral, structural, and time horizon — with what each looks like and which is most accessible to individual investors. (The answer is behavioral edge and time horizon edge — and they are both free.)
WHO THIS IS FOR:
Investors building portfolios. Founders managing business risk. Operators making capital allocation decisions. Anyone who has ever discovered that their 'diversified' portfolio all fell at the same time and wants to understand why.
FORMAT: PDF — Instant download. No subscription. Yours forever.
The most common risk management error is optimizing the wrong variable. Standard deviation measures price swings. Real risk is the probability and magnitude of permanent capital loss. A stock that swings 30% per year and compounds at 15% per decade has high volatility and low risk. A stock that barely moves for five years and then permanently falls 80% has low volatility and catastrophic risk.
This guide teaches risk management the way it actually works — with the frameworks used by serious investors, risk managers, and operators who cannot afford to get it wrong.
WHAT'S INSIDE — 8 CHAPTERS:
→ Defining Risk — What It Actually Is
The three-way distinction between uncertainty, risk, and volatility that most financial education conflates. A nine-row risk taxonomy covering idiosyncratic, systematic, factor, liquidity, concentration, leverage, valuation, business model, and regulatory risk — with whether each can be diversified away and the primary management tool for each. Benjamin Graham's margin of safety principle applied as a practical risk management framework.
→ Portfolio Risk Decomposition
For a diversified 20-stock US equity portfolio, approximately 85% of total risk typically comes from a single factor: market beta. This chapter explains how portfolio risk decomposes into systematic and idiosyncratic components, how factor risks sit within the systematic layer, and why understanding risk attribution is the prerequisite to managing it. A full asset pair correlation matrix across eight pairings showing normal vs. crisis correlation — and the implication of each.
→ Downside Protection Strategies
The mathematics of losses: a 50% loss requires a 100% gain to recover. A 75% loss requires a 300% gain. Protecting against large drawdowns is therefore worth dramatically more than generating equivalent additional upside. Eight downside protection strategies — from cash buffers through protective puts through short selling through position concentration limits — with mechanism, cost, and best-use context for each.
→ Diversification — The Right and Wrong Way
Seven diversification dimensions: asset class, geography, sector, factor, time horizon, currency, and liquidity. For each: what true diversification looks like and the most common false diversification that investors mistake for it. Owning 30 stocks in the same sector is a sector fund, not a diversified portfolio. This chapter makes the distinction rigorous and actionable.
→ Leverage Risk — The Silent Amplifier
The leverage risk mathematics: at 2× leverage, a 50% asset decline wipes out equity. At 10× leverage, a 10% decline does the same. At 30× leverage (pre-2008 banks), a 3.3% decline is sufficient. A six-row leverage table from no leverage to 30×+ with the asset decline required for wipeout, the probability of loss, and the appropriate context. The history of financial crises is largely a history of leverage cycles.
→ Liquidity Risk — The Overlooked Threat
Liquidity risk is systematically underpriced because it is invisible during normal markets and catastrophically expensive during crises. A nine-row liquidity spectrum from on-the-run US Treasuries through private equity — with normal liquidity, crisis liquidity, and the illiquidity premium each offers. The core insight: liquidity evaporates precisely when you most need it, which is why it must be planned for when you don't.
→ Tail Risk and Black Swan Events
Six historical tail events — 1987 Black Monday, LTCM, 9/11, the 2008 GFC, COVID, and the 2022 bond market — with magnitude, the number of standard deviations each represented, and why the model in use at the time assigned it near-zero probability. Four tail risk management strategies: anti-fragility, convexity seeking, stress testing beyond historical data, and the barbell strategy.
→ Asymmetric Risk/Reward — The Edge Framework
The expected value framework: probability-weighted outcomes across all scenarios, with a worked example showing how to calculate expected value and identify when the asymmetry favors investment. Five sources of investment edge — information, analytical, behavioral, structural, and time horizon — with what each looks like and which is most accessible to individual investors. (The answer is behavioral edge and time horizon edge — and they are both free.)
WHO THIS IS FOR:
Investors building portfolios. Founders managing business risk. Operators making capital allocation decisions. Anyone who has ever discovered that their 'diversified' portfolio all fell at the same time and wants to understand why.
FORMAT: PDF — Instant download. No subscription. Yours forever.